

Data Source: Firearms Tracing System
January 1, 2025 - December 31, 2025
Contents
- Introduction
- Analytical Criteria Used to Compile the FFL Theft/Loss Statistics
- Definitions
- Table: FFL Theft/Loss Firearm Counts by Firearm Type and FFL Theft/Loss Category
- Table: FFL Theft/Loss Reports by State/Territory and Theft/Loss Category
- Summation
Introduction
Federal firearms licensees (FFLs) must report to ATF each missing, lost, or stolen firearm from the FFL's inventory or collection within 48 hours of discovery of the loss or theft by completing and forwarding a Federal Firearms Licensee Theft/Loss Report (ATF Form 3310.11). In addition, the FFL must also report the firearm theft or loss to the appropriate local law enforcement agency.
Analytical Criteria Used to Compile the FFL Theft/Loss Statistics
Queries of the Firearms Tracing System (FTS) were used to determine which firearms were reported in Federal Firearms Licensee (FFL) Thefts/Losses. This information was extracted from the FTS on January 2, 2026, for calendar year 2025.
- FFL Theft/Loss Reports where the reported incident dates were from January 1, 2025, to December 31, 2025, were selected.
- Firearms reported in FFL Theft/Loss Reports and subsequently determined not lost/stolen were excluded from the totals.
- The high number of reported firearm losses associated with Arkansas and Louisiana are due to a single Federal Firearms Licensee audit.
Definitions
Burglary: The unlawful entry of a structure to commit a felony or theft.
Larceny: The unlawful taking or carrying away property from the possessor or of another.
Robbery: Taking anything of value from the care, custody, or control of a person or persons by force or threat of force or violence.
Loss: When an FFL takes a firearm into its inventory and later cannot account for the disposition of the firearm from its inventory during an inventory reconciliation.
FFL Theft/Loss Firearm Counts by Firearm Type and FFL Theft/Loss Category
Calendar Year 2025
Firearm Types | TOTALS | Burglary | Larceny | Robbery | Loss |
|---|---|---|---|---|---|
| Pistols | 4,499 | 1,222 | 852 | 69 | 2,356 |
| Rifles | 2,593 | 334 | 265 | 5 | 1,989 |
| Shotguns | 1,188 | 88 | 74 | 3 | 1,023 |
| Receivers/Frames | 1,043 | 23 | 32 | 0 | 988 |
| Revolvers | 762 | 54 | 70 | 0 | 638 |
| Silencers | 197 | 13 | 38 | 0 | 146 |
| Derringers | 49 | 9 | 2 | 0 | 38 |
| Unknown Types | 34 | 5 | 1 | 0 | 28 |
| Machineguns | 9 | 0 | 4 | 0 | 5 |
| Combination Guns | 7 | 0 | 0 | 0 | 7 |
| Any Other Weapons | 1 | 0 | 0 | 0 | 1 |
| Destructive Devices | 1 | 0 | 0 | 0 | 1 |
| TOTALS | 10,383 | 1,748 | 1,338 | 77 | 7,220 |
Scroll horizontally if needed to view full table.
FFL Theft/Loss Reports by State/Territory and Theft/Loss Category
Calendar Year 2025
State/Territory | All | Burglary | Larceny | Robbery | Loss | |||||
|---|---|---|---|---|---|---|---|---|---|---|
Reports | Firearm | Reports | Firearm | Reports | Firearm | Reports | Firearm | Reports | Firearm | |
| Alabama | 45 | 124 | 6 | 50 | 14 | 18 | 0 | 0 | 25 | 56 |
| Alaska | 13 | 29 | 1 | 17 | 8 | 8 | 0 | 0 | 4 | 4 |
| Arizona | 56 | 233 | 6 | 47 | 18 | 100 | 3 | 29 | 29 | 57 |
| Arkansas | 41 | 293 | 4 | 22 | 7 | 15 | 0 | 0 | 30 | 256 |
| California | 154 | 334 | 9 | 72 | 103 | 119 | 3 | 3 | 39 | 140 |
| Colorado | 27 | 182 | 8 | 124 | 9 | 18 | 0 | 0 | 10 | 40 |
| Connecticut | 19 | 226 | 1 | 9 | 1 | 1 | 0 | 0 | 17 | 216 |
| Delaware | 3 | 4 | 0 | 0 | 1 | 1 | 0 | 0 | 2 | 3 |
| Florida | 98 | 476 | 0 | 0 | 12 | 56 | 0 | 0 | 86 | 420 |
| Georgia | 75 | 363 | 8 | 69 | 21 | 30 | 0 | 0 | 46 | 264 |
| Guam | 0 | 0 | 0 | 0 | 0 | 0 | 0 | 0 | 0 | 0 |
| Hawaii | 0 | 0 | 0 | 0 | 0 | 0 | 0 | 0 | 0 | 0 |
| Idaho | 19 | 294 | 1 | 1 | 3 | 3 | 0 | 0 | 15 | 290 |
| Illinois | 26 | 192 | 5 | 28 | 2 | 7 | 0 | 0 | 19 | 157 |
| Indiana | 36 | 74 | 6 | 15 | 11 | 12 | 0 | 0 | 19 | 47 |
| Iowa | 12 | 87 | 1 | 14 | 3 | 3 | 0 | 0 | 8 | 70 |
| Kansas | 24 | 69 | 1 | 10 | 12 | 18 | 0 | 0 | 11 | 41 |
| Kentucky | 33 | 116 | 4 | 25 | 7 | 7 | 0 | 0 | 22 | 84 |
| Louisiana | 33 | 469 | 3 | 24 | 12 | 23 | 0 | 0 | 18 | 422 |
| Maine | 9 | 24 | 1 | 5 | 3 | 5 | 0 | 0 | 5 | 14 |
| Maryland | 21 | 45 | 1 | 13 | 4 | 5 | 1 | 4 | 15 | 23 |
| Massachusetts | 14 | 46 | 2 | 6 | 2 | 2 | 0 | 0 | 10 | 38 |
| Michigan | 33 | 511 | 5 | 49 | 3 | 180 | 0 | 0 | 25 | 282 |
| Minnesota | 26 | 360 | 2 | 10 | 5 | 5 | 0 | 0 | 19 | 345 |
| Mississippi | 36 | 201 | 11 | 84 | 6 | 7 | 0 | 0 | 19 | 110 |
| Missouri | 39 | 249 | 1 | 20 | 12 | 99 | 1 | 1 | 25 | 129 |
| Montana | 18 | 263 | 2 | 17 | 4 | 30 | 0 | 0 | 12 | 216 |
| Nebraska | 16 | 77 | 0 | 0 | 3 | 3 | 0 | 0 | 13 | 74 |
| Nevada | 24 | 67 | 2 | 13 | 10 | 19 | 0 | 0 | 12 | 35 |
| New Hampshire | 17 | 94 | 0 | 0 | 1 | 1 | 0 | 0 | 16 | 93 |
| New Jersey | 5 | 102 | 0 | 0 | 0 | 0 | 0 | 0 | 5 | 102 |
| New Mexico | 18 | 49 | 3 | 15 | 4 | 10 | 0 | 0 | 11 | 24 |
| New York | 19 | 126 | 1 | 9 | 0 | 0 | 0 | 0 | 18 | 117 |
| North Carolina | 78 | 717 | 10 | 69 | 18 | 217 | 2 | 2 | 48 | 429 |
| North Dakota | 2 | 6 | 1 | 5 | 1 | 1 | 0 | 0 | 0 | 0 |
| Northern Mariana Islands | 0 | 0 | 0 | 0 | 0 | 0 | 0 | 0 | 0 | 0 |
| Ohio | 39 | 108 | 3 | 49 | 13 | 18 | 0 | 0 | 23 | 41 |
| Oklahoma | 39 | 176 | 9 | 65 | 11 | 24 | 0 | 0 | 19 | 87 |
| Oregon | 14 | 94 | 2 | 7 | 4 | 4 | 0 | 0 | 8 | 83 |
| Pennsylvania | 161 | 837 | 8 | 163 | 70 | 73 | 10 | 10 | 73 | 591 |
| Puerto Rico | 0 | 0 | 0 | 0 | 0 | 0 | 0 | 0 | 0 | 0 |
| Rhode Island | 6 | 250 | 0 | 0 | 0 | 0 | 0 | 0 | 6 | 250 |
| South Carolina | 36 | 351 | 9 | 86 | 9 | 9 | 0 | 0 | 18 | 256 |
| South Dakota | 10 | 24 | 0 | 0 | 3 | 4 | 0 | 0 | 7 | 20 |
| Tennessee | 61 | 323 | 7 | 113 | 16 | 22 | 1 | 3 | 37 | 185 |
| Texas | 136 | 740 | 24 | 296 | 45 | 60 | 5 | 25 | 62 | 359 |
| U.S. Virgin Islands | 0 | 0 | 0 | 0 | 0 | 0 | 0 | 0 | 0 | 0 |
| Utah | 30 | 216 | 4 | 23 | 5 | 7 | 0 | 0 | 21 | 186 |
| Vermont | 9 | 36 | 0 | 0 | 0 | 0 | 0 | 0 | 9 | 36 |
| Virginia | 53 | 167 | 5 | 63 | 16 | 21 | 0 | 0 | 32 | 83 |
| Washington | 23 | 303 | 2 | 38 | 7 | 10 | 0 | 0 | 14 | 255 |
| Washington D.C. | 0 | 0 | 0 | 0 | 0 | 0 | 0 | 0 | 0 | 0 |
| West Virginia | 11 | 102 | 1 | 1 | 2 | 3 | 0 | 0 | 8 | 98 |
| Wisconsin | 29 | 91 | 1 | 2 | 9 | 14 | 0 | 0 | 19 | 75 |
| Wyoming | 7 | 63 | 0 | 0 | 1 | 46 | 0 | 0 | 6 | 17 |
| TOTAL | 1,753 | 10,383 | 181 | 1,748 | 531 | 1,338 | 26 | 77 | 1,015 | 7,220 |
Scroll horizontally if needed to view full table.
Summation
For calendar year 2025, ATF data provides that the 10 FFLs with the most firearms reported in Theft/Loss Reports are associated with 2,093 firearms reported lost or stolen. The 100 FFLs with the most firearms reported in Theft/Loss Reports are associated with 5,182 firearms reported lost or stolen. This data is limited to Type 01 (dealer in firearms other than destructive devices) and Type 02 (pawnbroker in firearms other than destructive devices) FFLs. Five FFLs tied in the final ranking of the 100, Type 01 and Type 02 FFLs resulting in 101 total FFLs.
FFL Burglary Incidents ‒ Summary of Data
(CY 2024 and CY 2025)
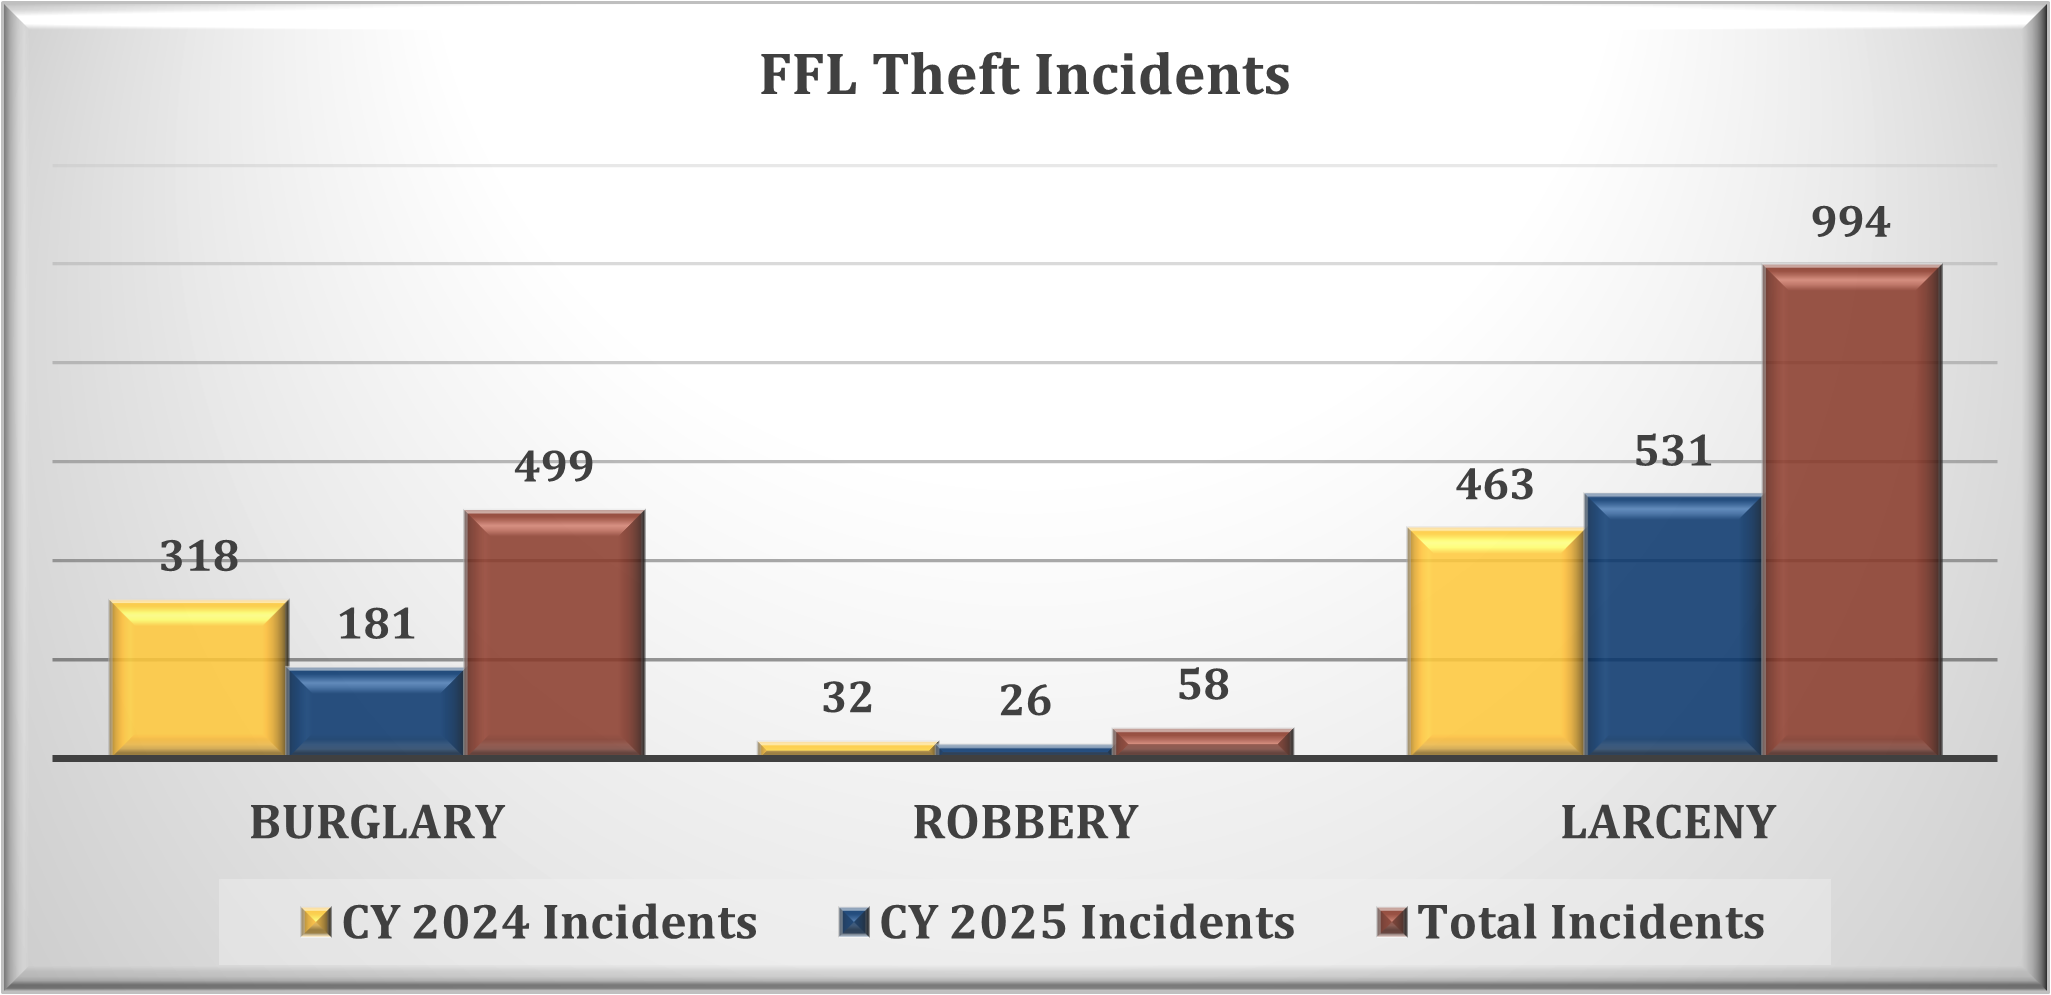
Chart - FFL Theft Incidents for calendar years 2024 and 2025 CY 2024: - Burglary: 4,389 - Robbery: 119 - Larceny: 770 CY 2025: - Burglary: 1,389 - Robbery: 77 - Larceny: 1,338
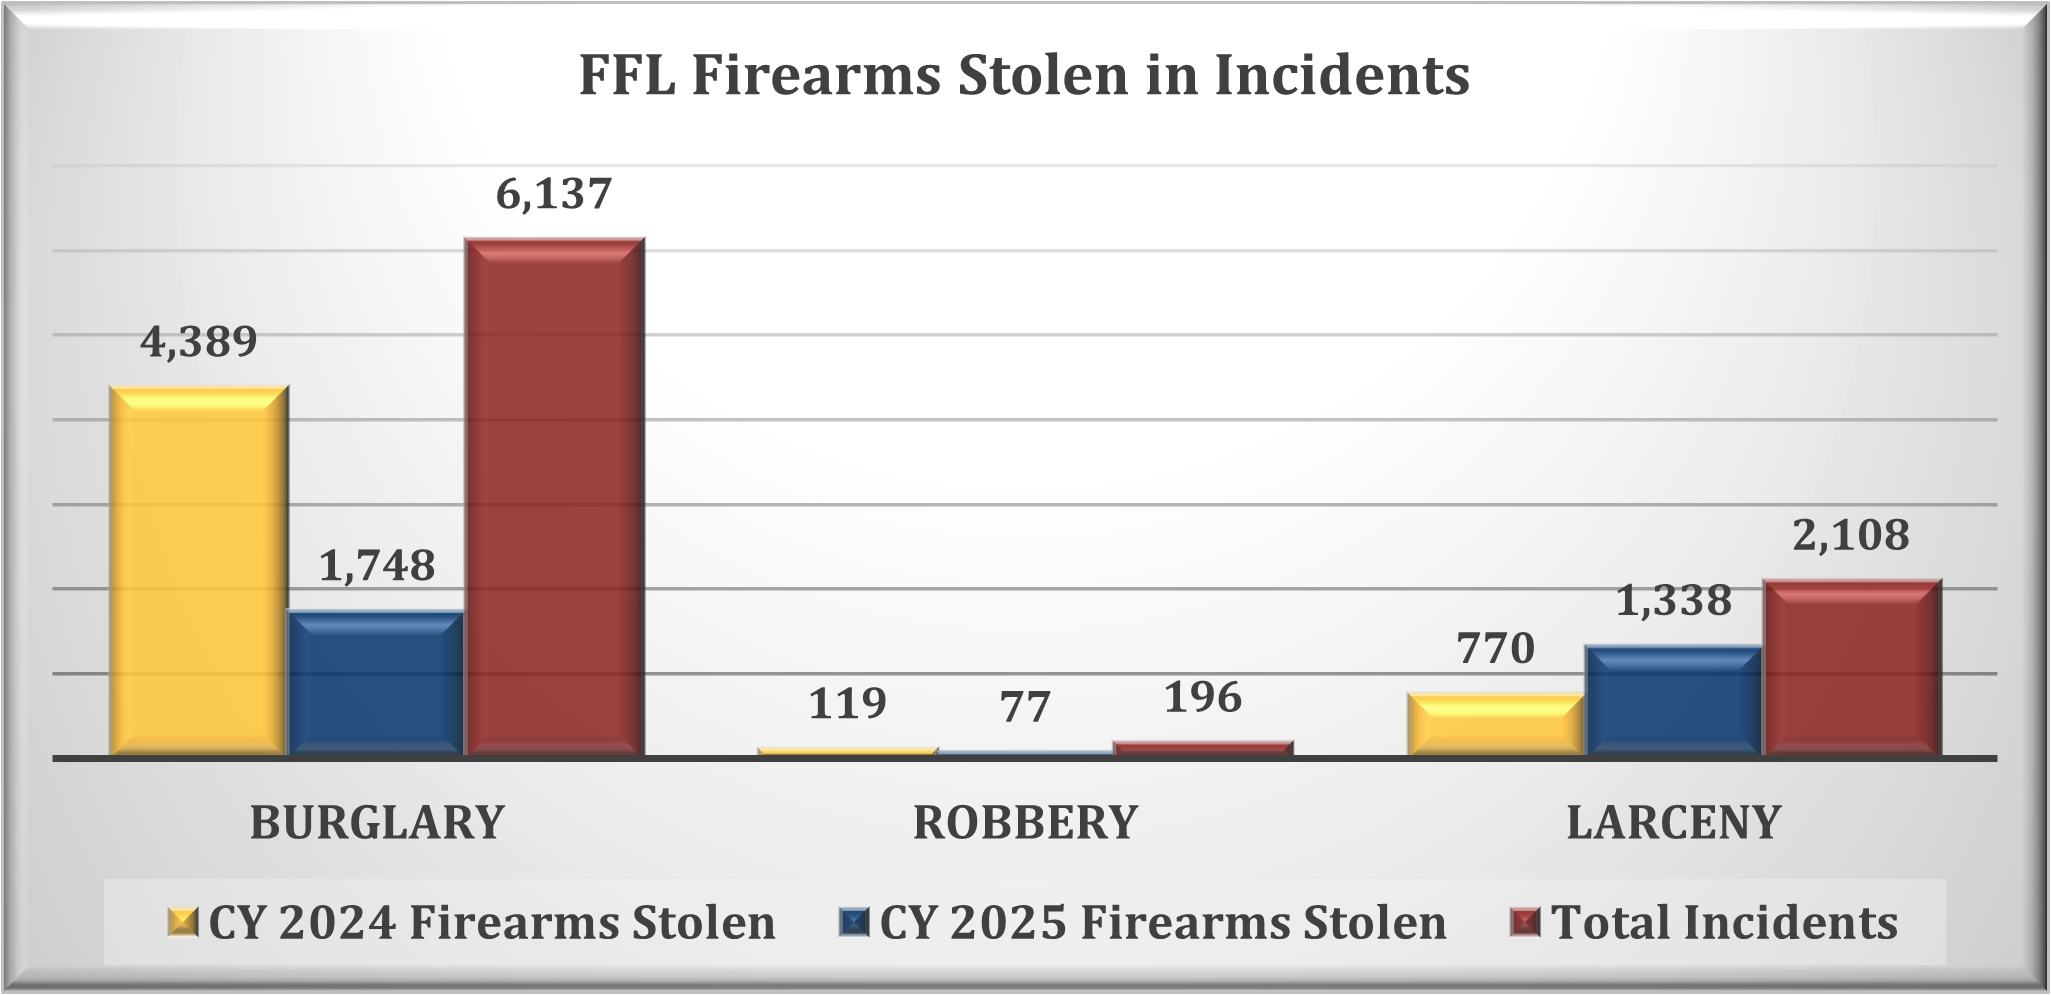
Chart displaying the analytics for Calendar Years 2024 and 2025 FFL Firearms Stolen in Incidents. CY 2024 - Burglary: 4,389 - Robbery: 119 - Larceny: 770 CY 2025 - Burglary: 1,748 - Robbery: 77 - Larceny: 1,338
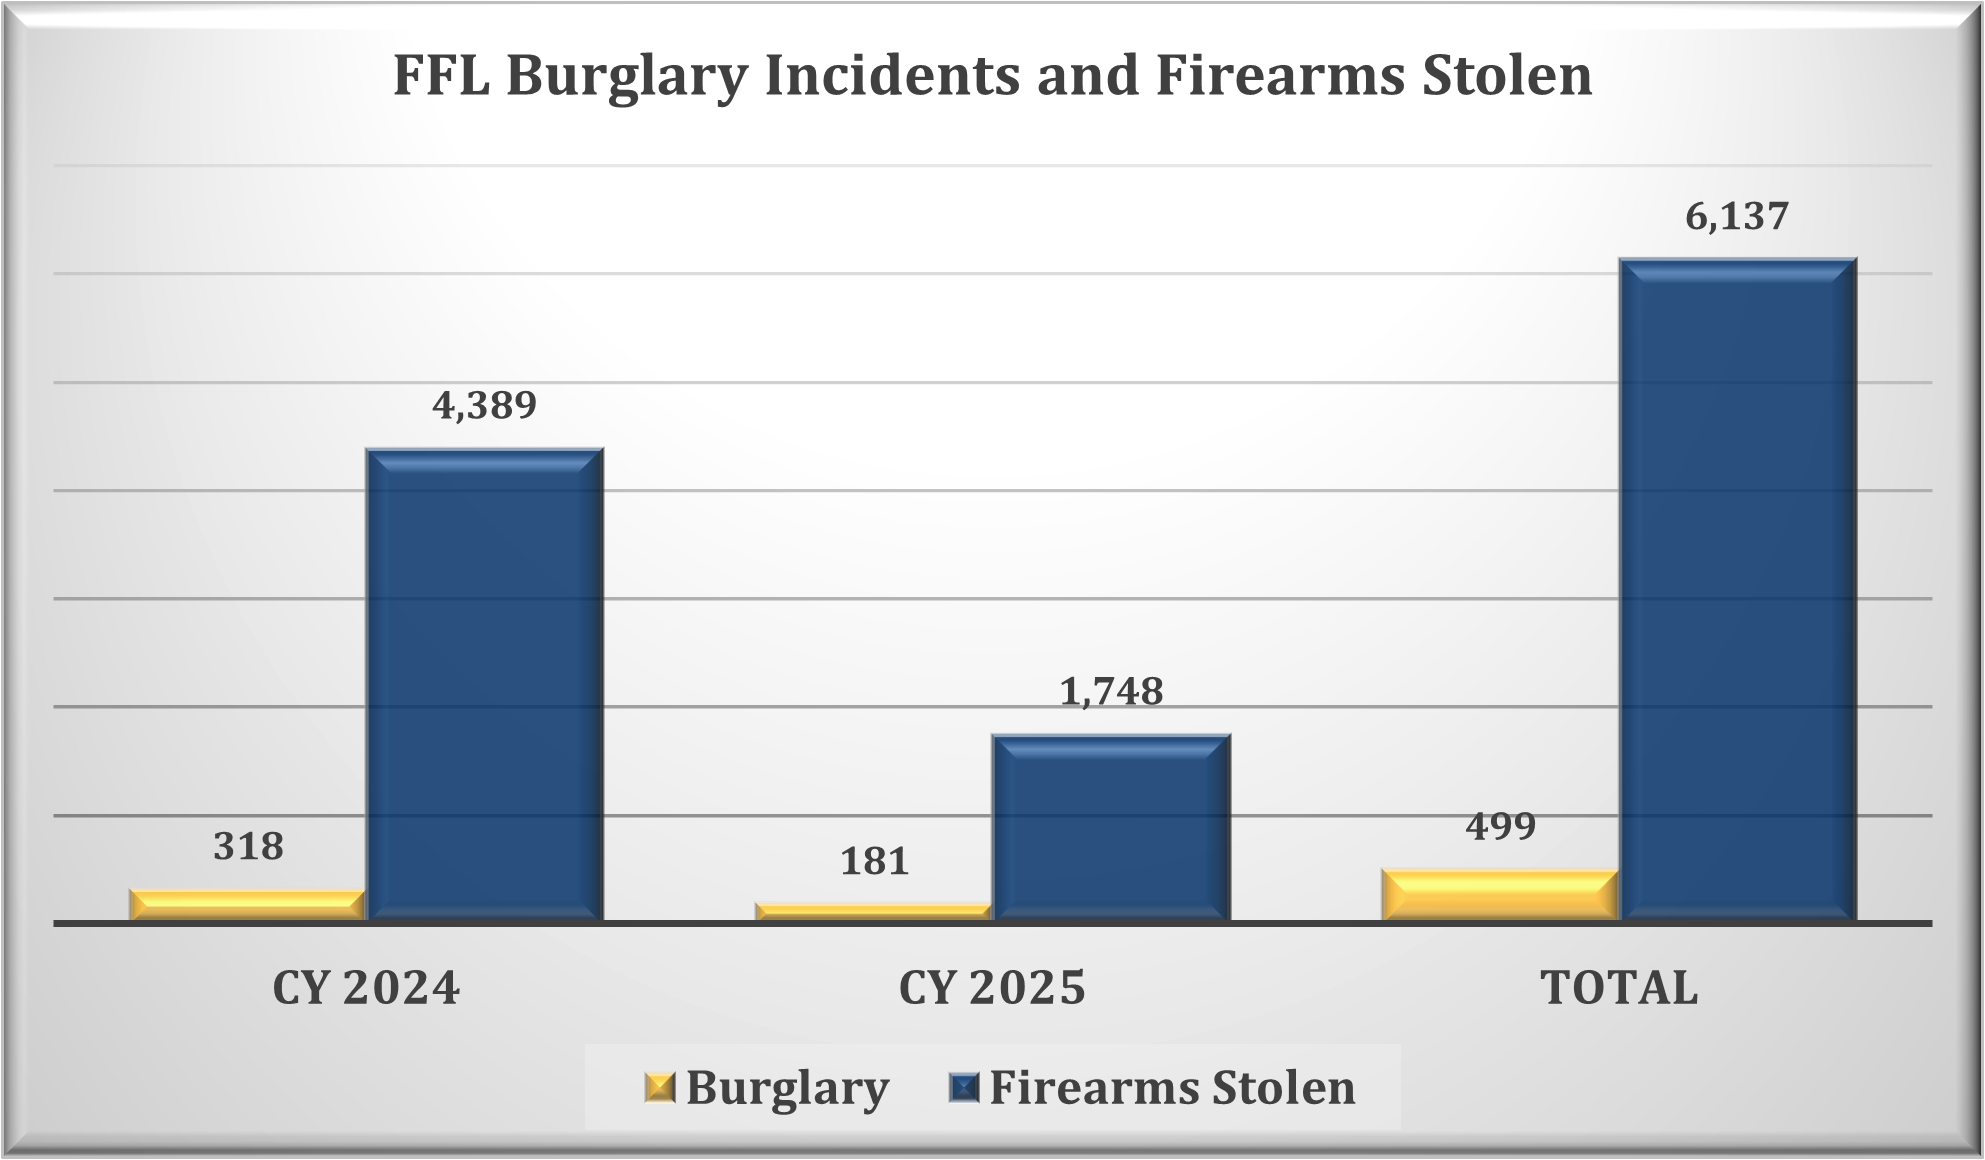
Chart - Calendar Years 2024 and 2025 FFL Burglary Incidents and Firearms Stolen
FFL Burglary Incidents - Modus Operandi
(CY 2024 and CY 2025)
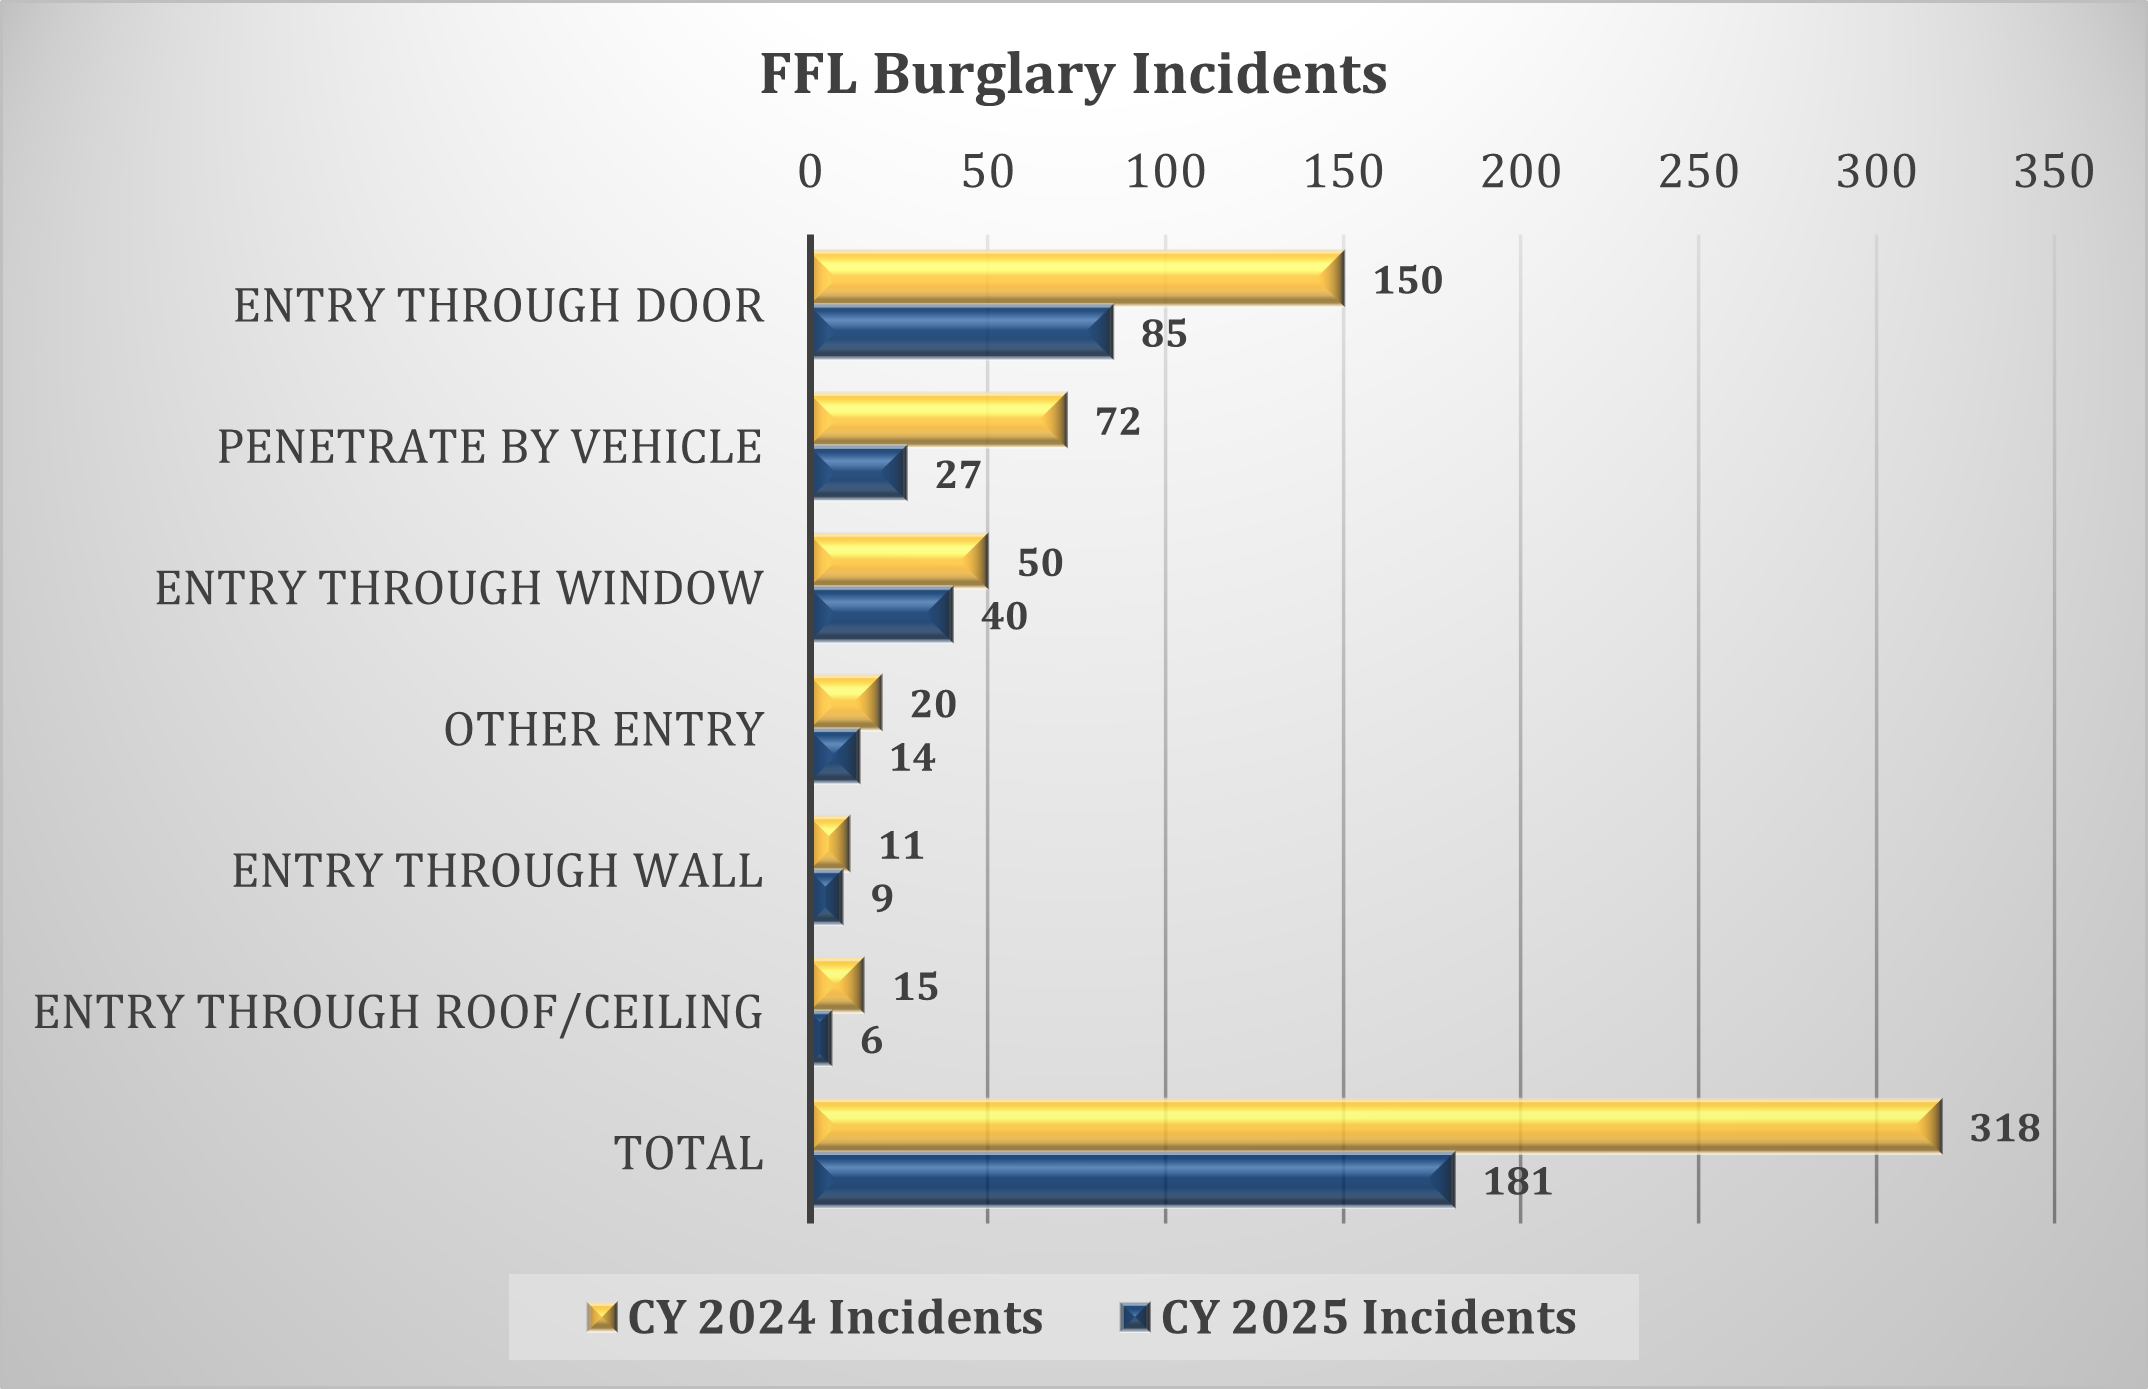
Chart - Calendar Years 2024 and 2025 FFL Burglary Incidents The top three modus operandi associated with an FFL burglary incidents for CY 2024 and CY 2025 were identified as “Entry Through Door” (235 incidents); “Penetrate by Vehicle” (99 incidents); and “Entry Through Window” (90 incidents). In CY 2025, all three of the top modus operandi experienced a decrease: “Entry Through Door” (43% decrease); “Penetrate by Vehicle” (63% decrease); and “Entry Through Window” (20% decrease).
The top three modus operandi associated with an FFL burglary incidents for CY 2024 and CY 2025 were identified as “Entry Through Door” (235 incidents); “Penetrate by Vehicle” (99 incidents); and “Entry Through Window” (90 incidents). In CY 2025, all three of the top modus operandi experienced a decrease: “Entry Through Door” (43% decrease); “Penetrate by Vehicle” (63% decrease); and “Entry Through Window” (20% decrease).
FFL Burglary Incidents - Modus Operandi Including Number of Firearms Stolen
(CY 2024 and CY 2025)
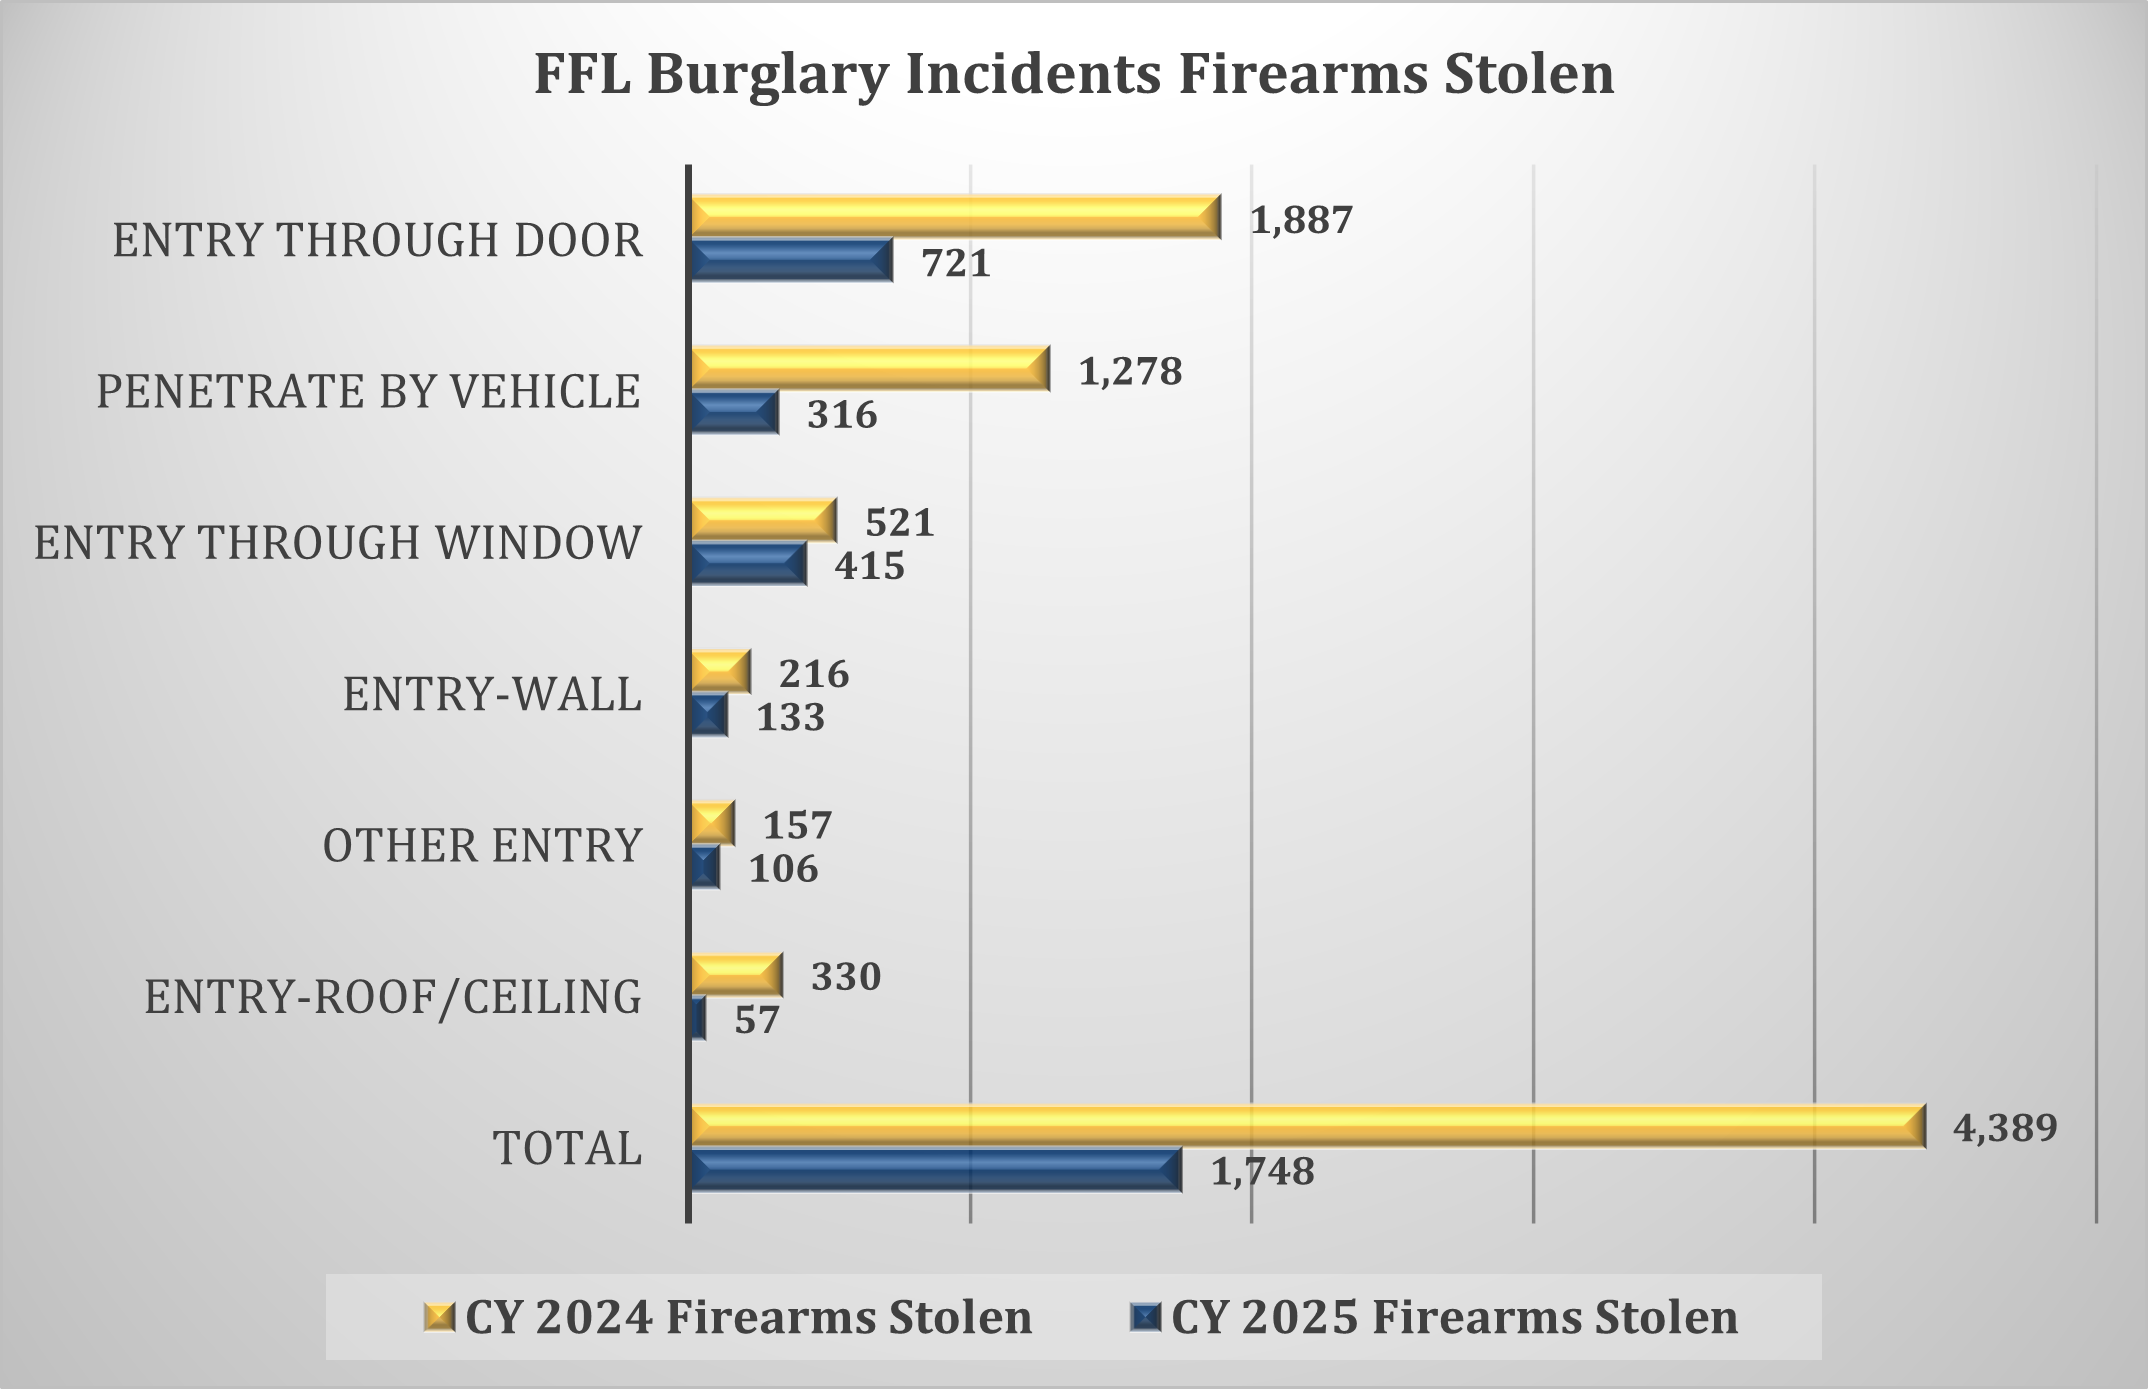
Chart - Calendar Years 2024 and 2025 FFL Burglary Incidents and Firearms Stolen
During CY 2024 and CY 2025, the modus operandi most associated with an FFL burglary incident was identified as “Entry Through Door” with 2,608 firearms reported as stolen; second most associated “Penetrate by Vehicle” with 1,594 firearms reported as stolen; and third most associated “Entry Through Window”, with 936 firearms reported as stolen. In CY 2025, all three of the top modus operandi experienced a decrease in the number of firearms reported stolen: “Entry Through Door” (62% decrease); “Penetrate by Vehicle” (75% decrease); and “Entry Through Window” (20% decrease).
FFL Larceny Incidents ‒ Comparison
(CY 2024 and CY 2025)
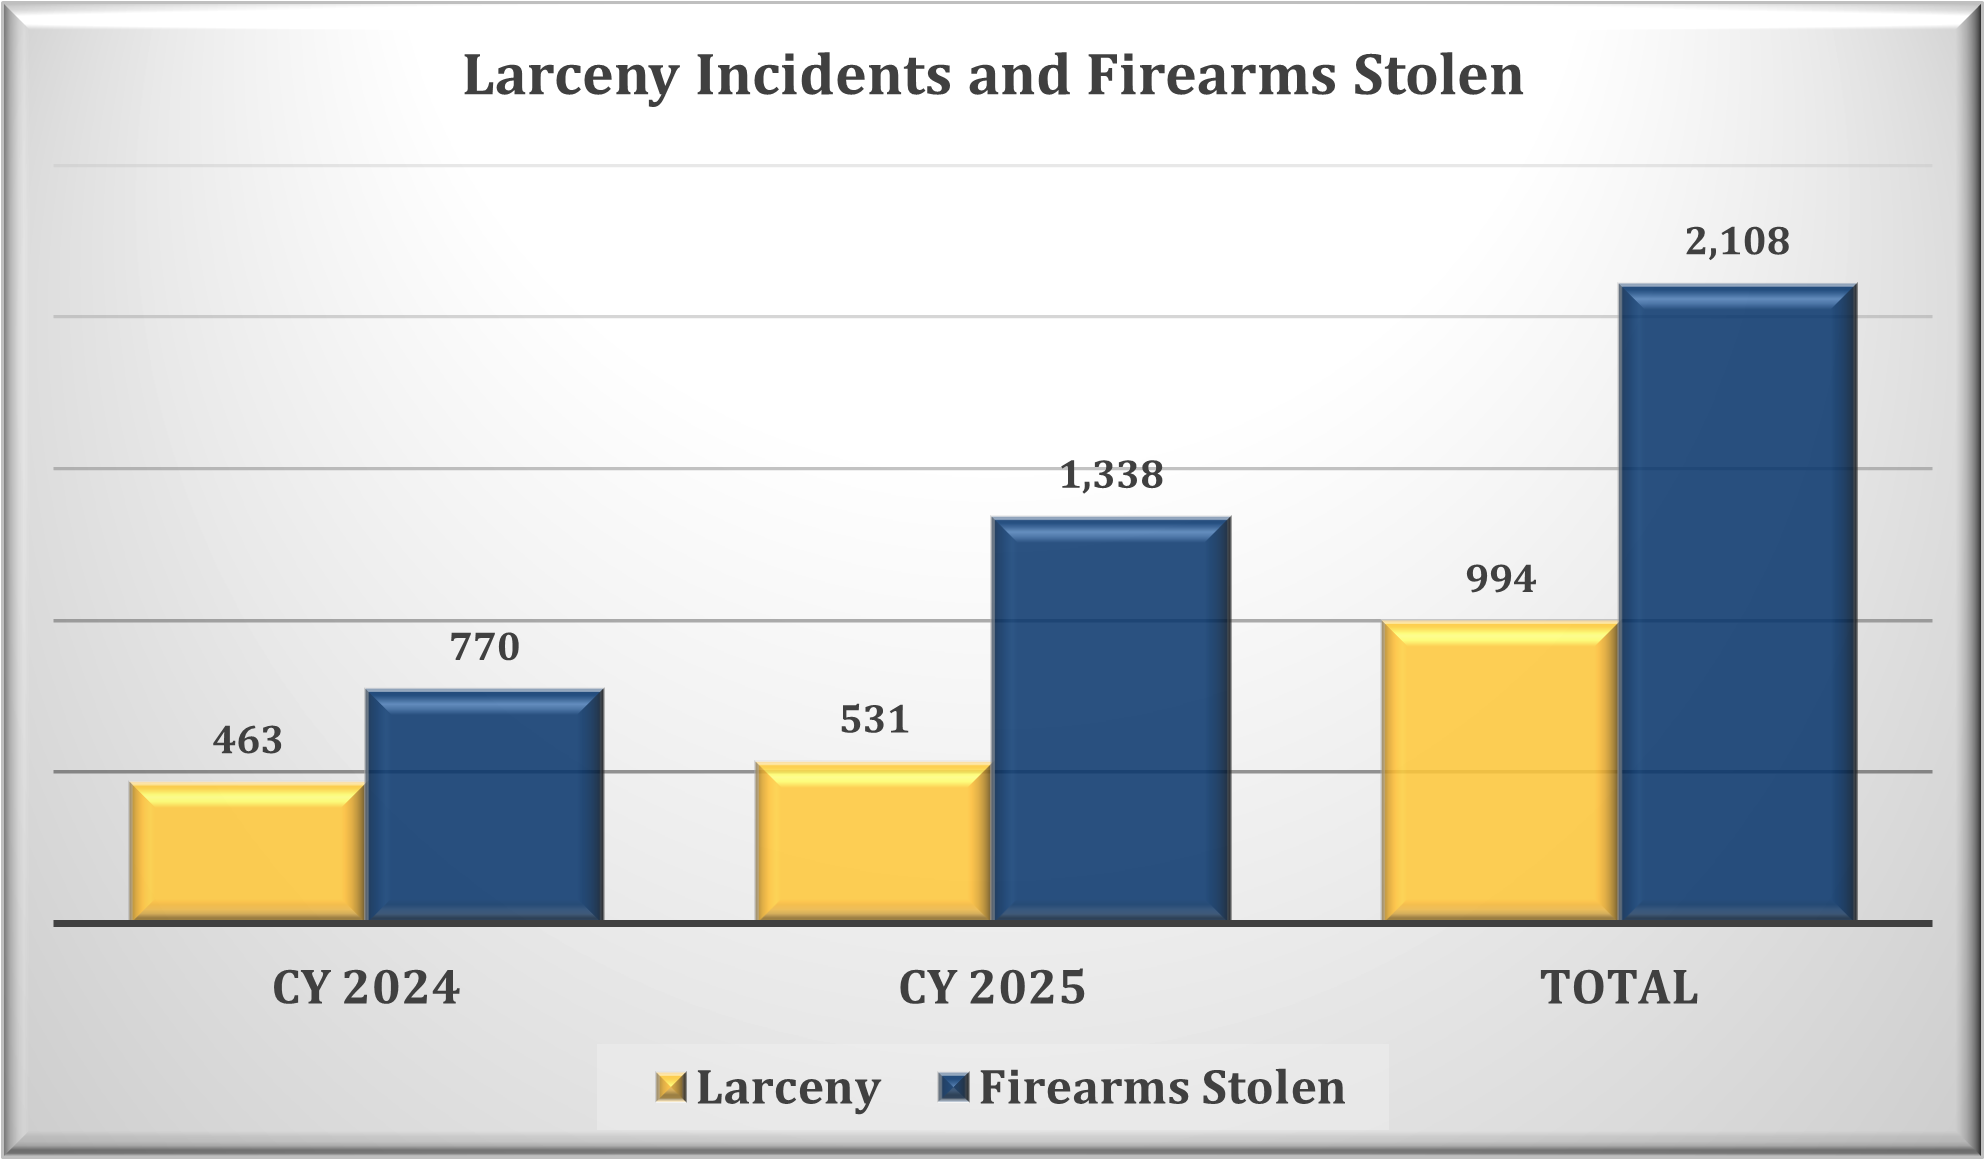
Bar Chart - Calendar Years 2024 and 2025 Comparison of Larceny Incidents and Firearms Stolen CY 2024 - Larceny: 463 - Firearms Stolen: 770 CY 2025 - Larceny: 531 - Firearms Stolen: 1,338 Total - CY 2024: 994 - CY 2025: 2,108
In CY 2025, the number of larceny incidents increased by 15% and the number of firearms stolen increased by 74%, when compared to the same timeframe in CY 2024.
FFL Larceny Incidents ‒ Top Modus Operandi
(CY 2024 and CY 2025)
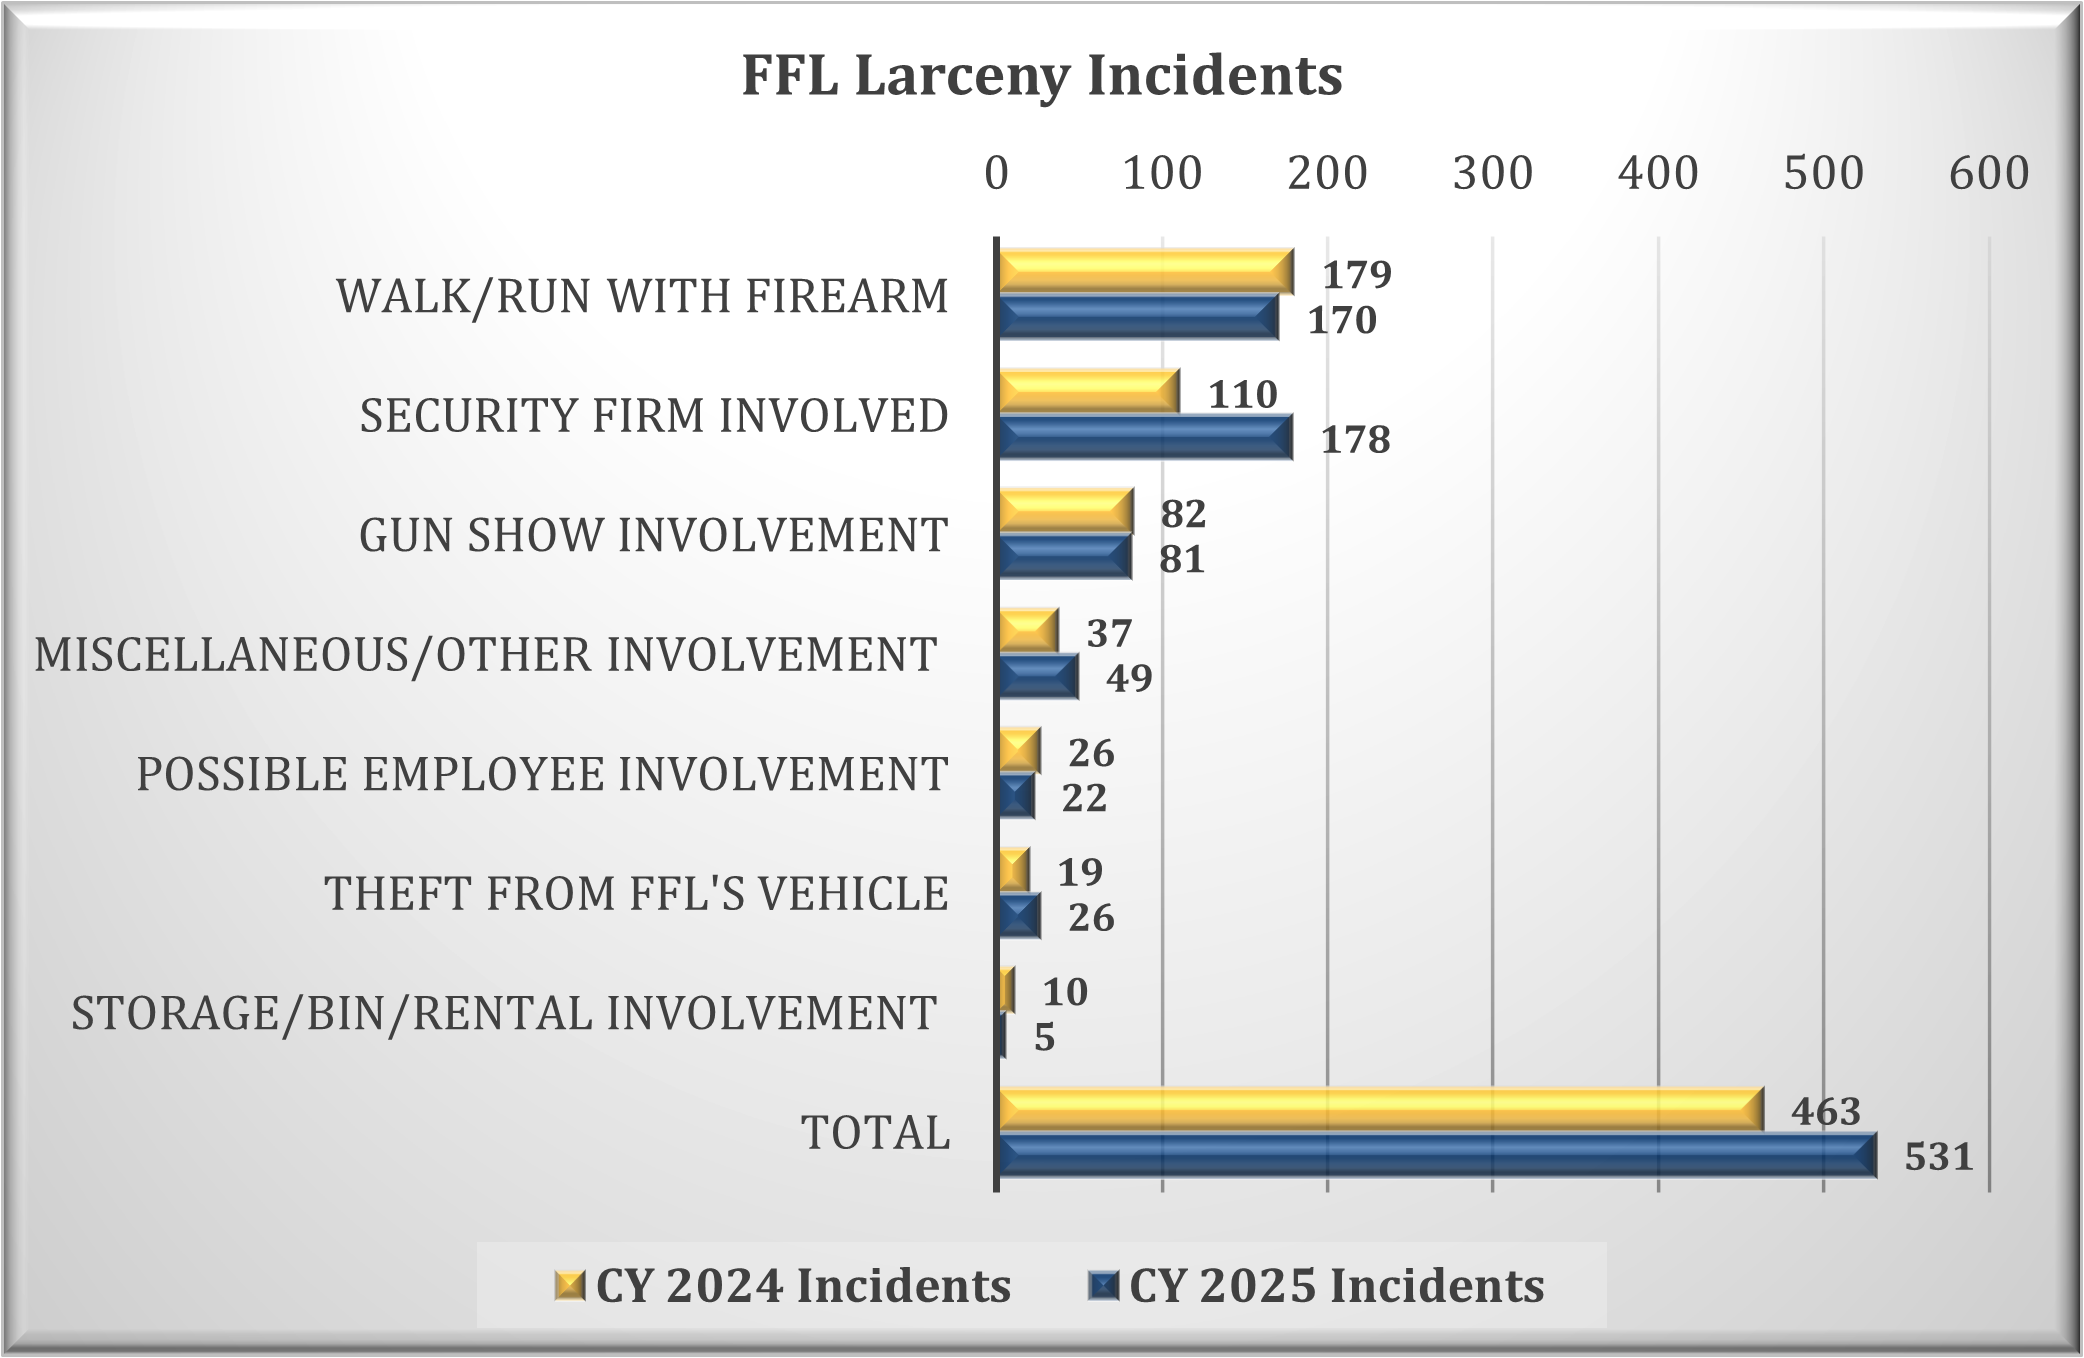
Chart - Calendar Years 2024 and 2025 top three modus operandi associated with FFL larceny incidents. CY 2024: -Walk/run with firearm: 179 -Security firm involved: 110 -Gun show involvement: 82 -Miscellaneous/Other involvement: 37 -Possible employee involvement: 26 -Theft from FFL's vehicle: 19 -Storage/bin/rental involvement: 10 -Total: 463 CY 2025: -Walk/run with firearm: 170 -Security firm involved: 178 -Gun show involvement: 81 -Miscellaneous/Other involvement: 49 -Possible employee involvement: 22 -Theft from FFL's vehicle: 26 -Storage/bin/rental involvement: 5 -Total: 531
The top three modus operandi associated with an FFL larceny incidents for CY 2024 and CY 2025 were identified as “Walk/Run with Firearm” (349 incidents); “Security Firm Involvement” (288 incidents); and “Gun Show Involvement” (163 incidents). In CY 2025, the number of Walk/Run with Firearm” larceny incidents decreased by 5%; the number of “Security Firm Involvement” larceny incidents increased by 62%; and the number of “Gun Show Involvement” larceny incidents decreased by 1%.
FFL Larceny Incidents ‒ Top Modus Operandi and Firearms Stolen
(CY 2024 and CY 2025)
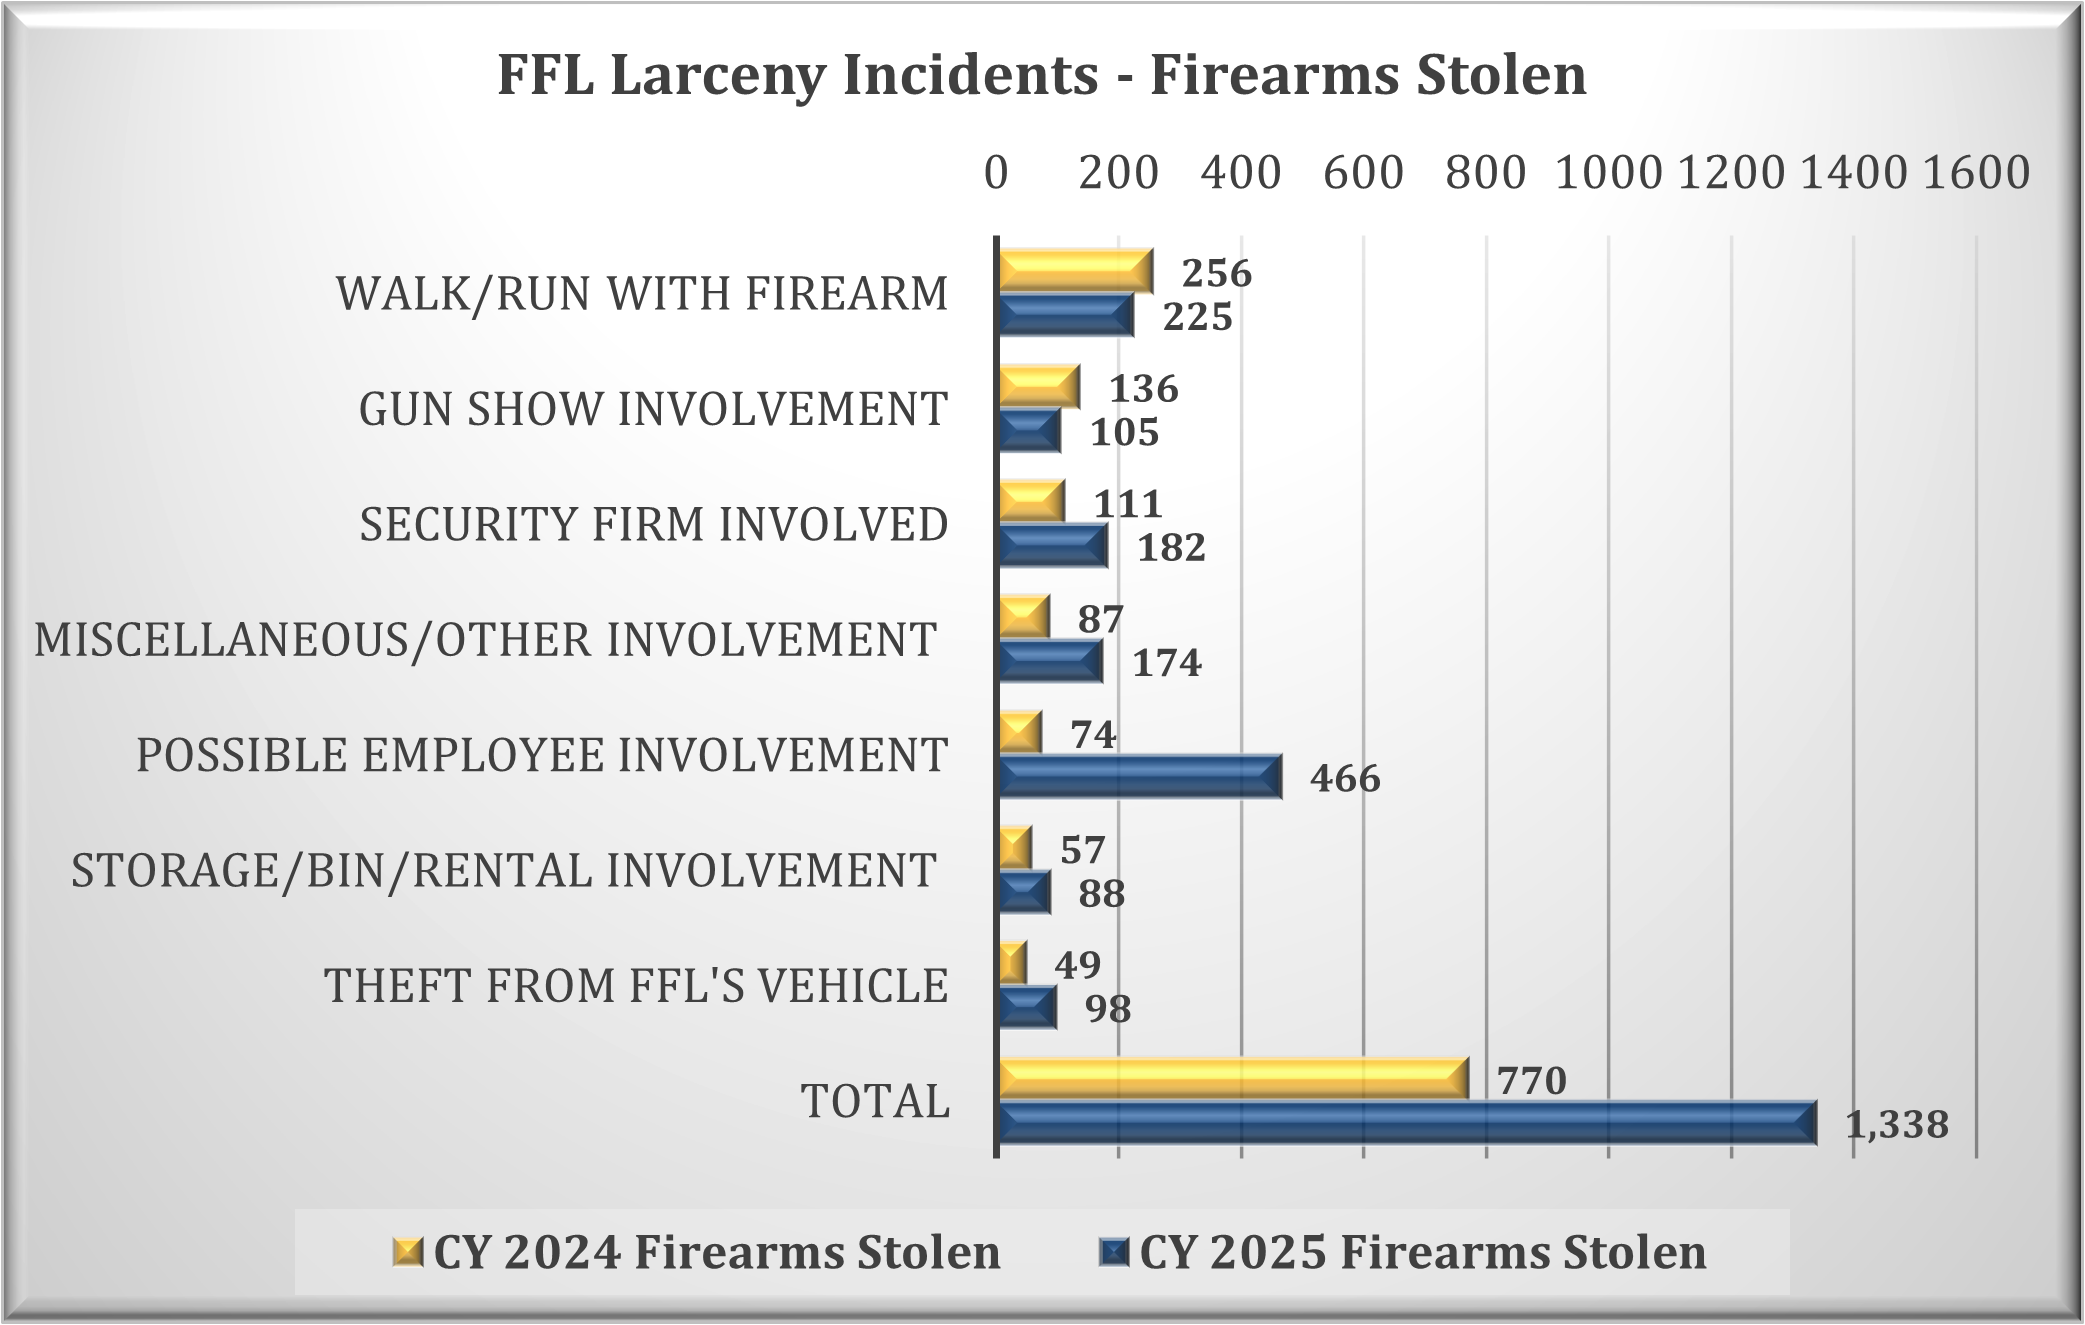
Chart - Top three modus operandi associated with Calendar Years 2024 and 2025 FFL Larceny Incidents - Firearms Stolen CY 2024: -walk/run with firearm: 256 -gun show involvement:136 -security firm involved: 111 -miscellaneous/other involvement: 87 -possible employee involvement: 74 -storage/bin/rental involvement:57 -theft from FFL's vehicle: 49 -total: 770 CY 2025 -walk/run with firearm: 225 -gun show involvement: 105 -security firm involved: 182 -miscellaneous/other involvement: 174 -possible employee involvement: 466 -storage/bin/rental involvement: 88 -theft from FFL's vehicle: 98 -total: 1,338
As previous mentioned, the top three modus operandi associated with an FFL larceny incidents for CY 2024 and CY 2025 were identified as “Walk/Run with Firearm”; “Gun Show Involvement”; “Security Firm Involved”. During the CY 2024 and CY 2025, time-period, in Walk/Run with Firearm” larceny incidents (481) firearms were reported stolen; in “Gun Show Involvement” larceny incidents (241) firearms were reported stolen; and “Security Firm Involvement” larceny incidents (293) firearms were reported stolen.
FFL Robbery Incidents ‒ Comparison
(CY 2024 and CY 2025)
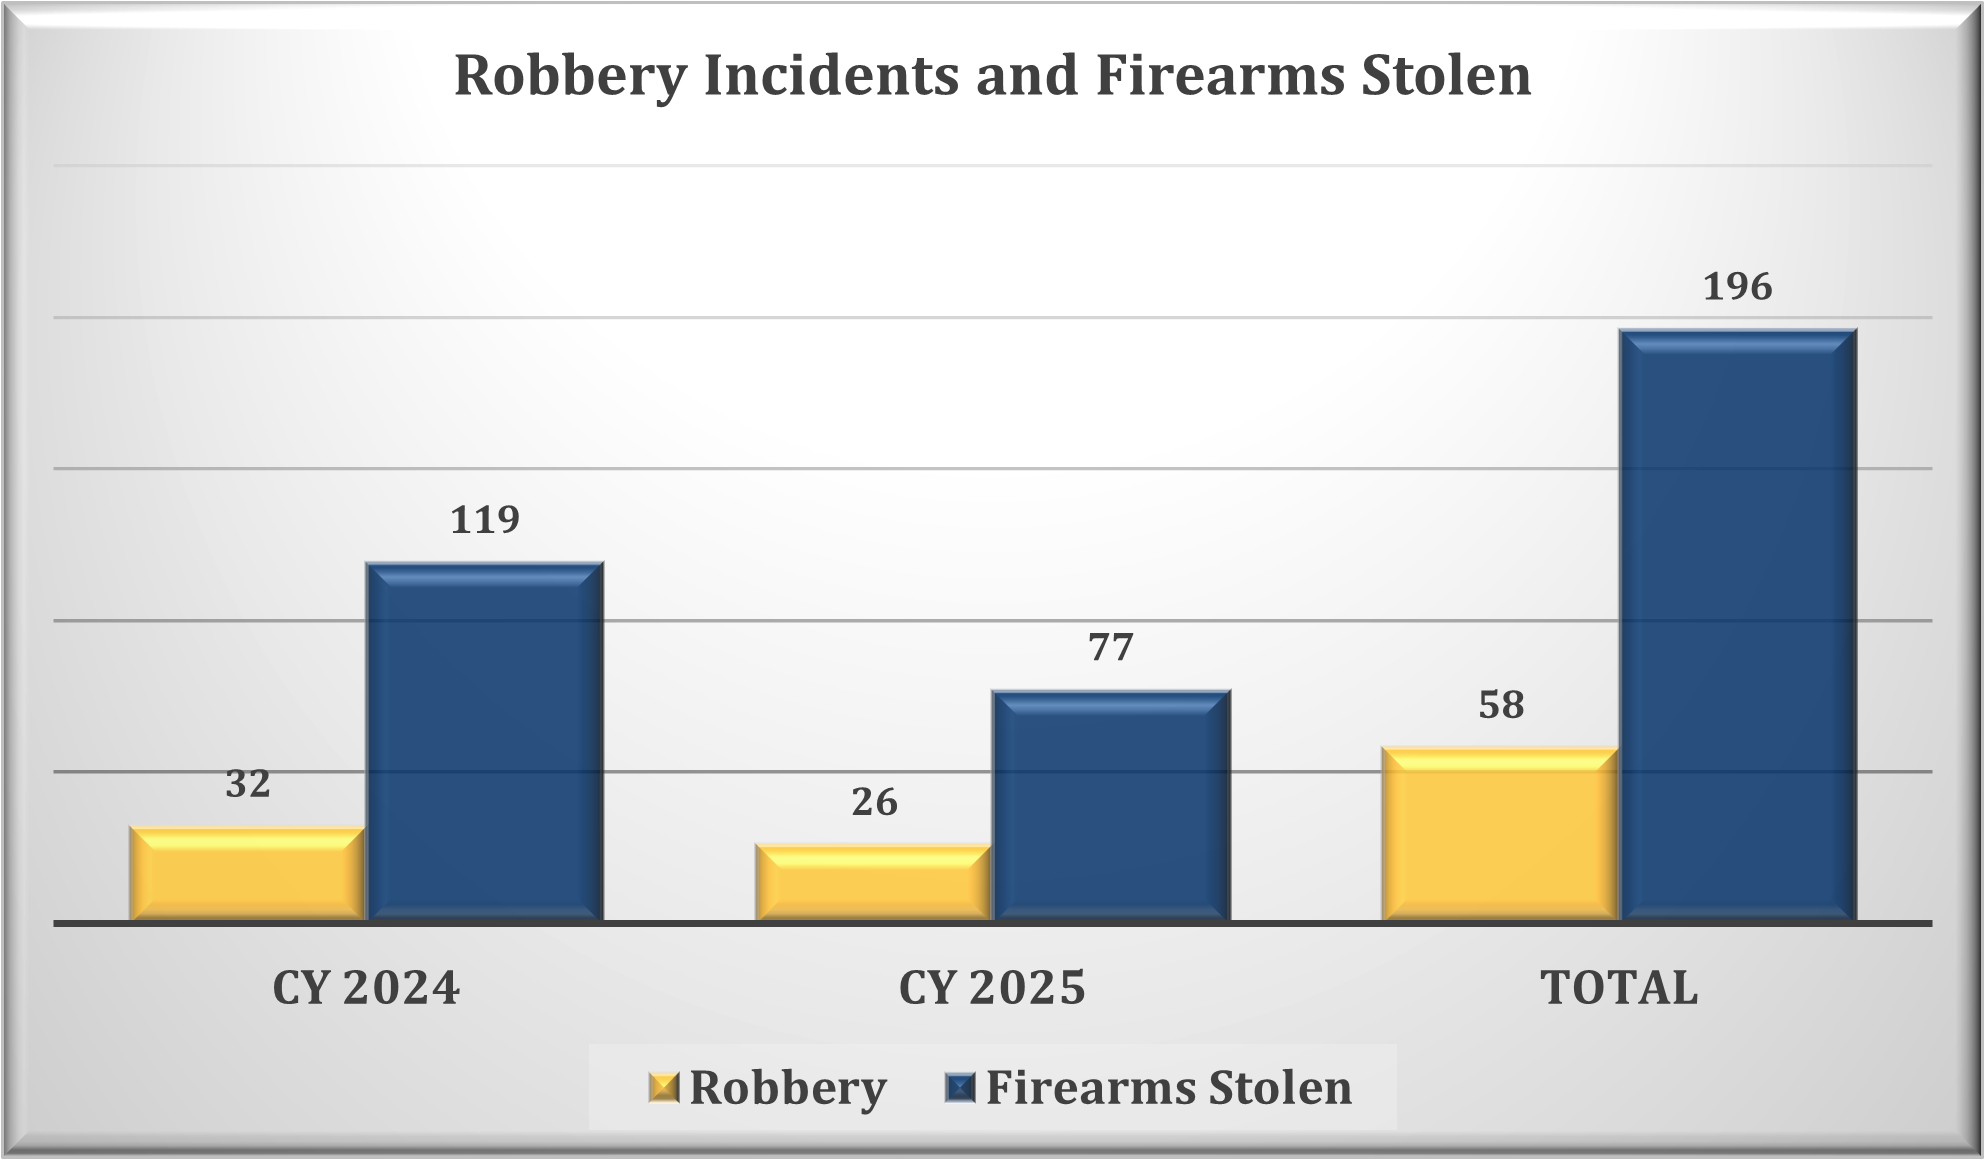
Chart - Calendar Years 2024 and 2025 Robbery Incidents and Firearms Stolen CY 2024: -Robbery: 32 -Firearms Stolen: 26 -Total: 58 CY 2025: -Robbery: 119 -Firearms Stolen: 77 -Total: 196
In CY 2025, the number of robbery incidents declined by 19% and the number of firearms stolen declined 35%, when compared to the same timeframe in CY 2024.
FFL Robbery Incidents
(CY 2024 and CY 2025)
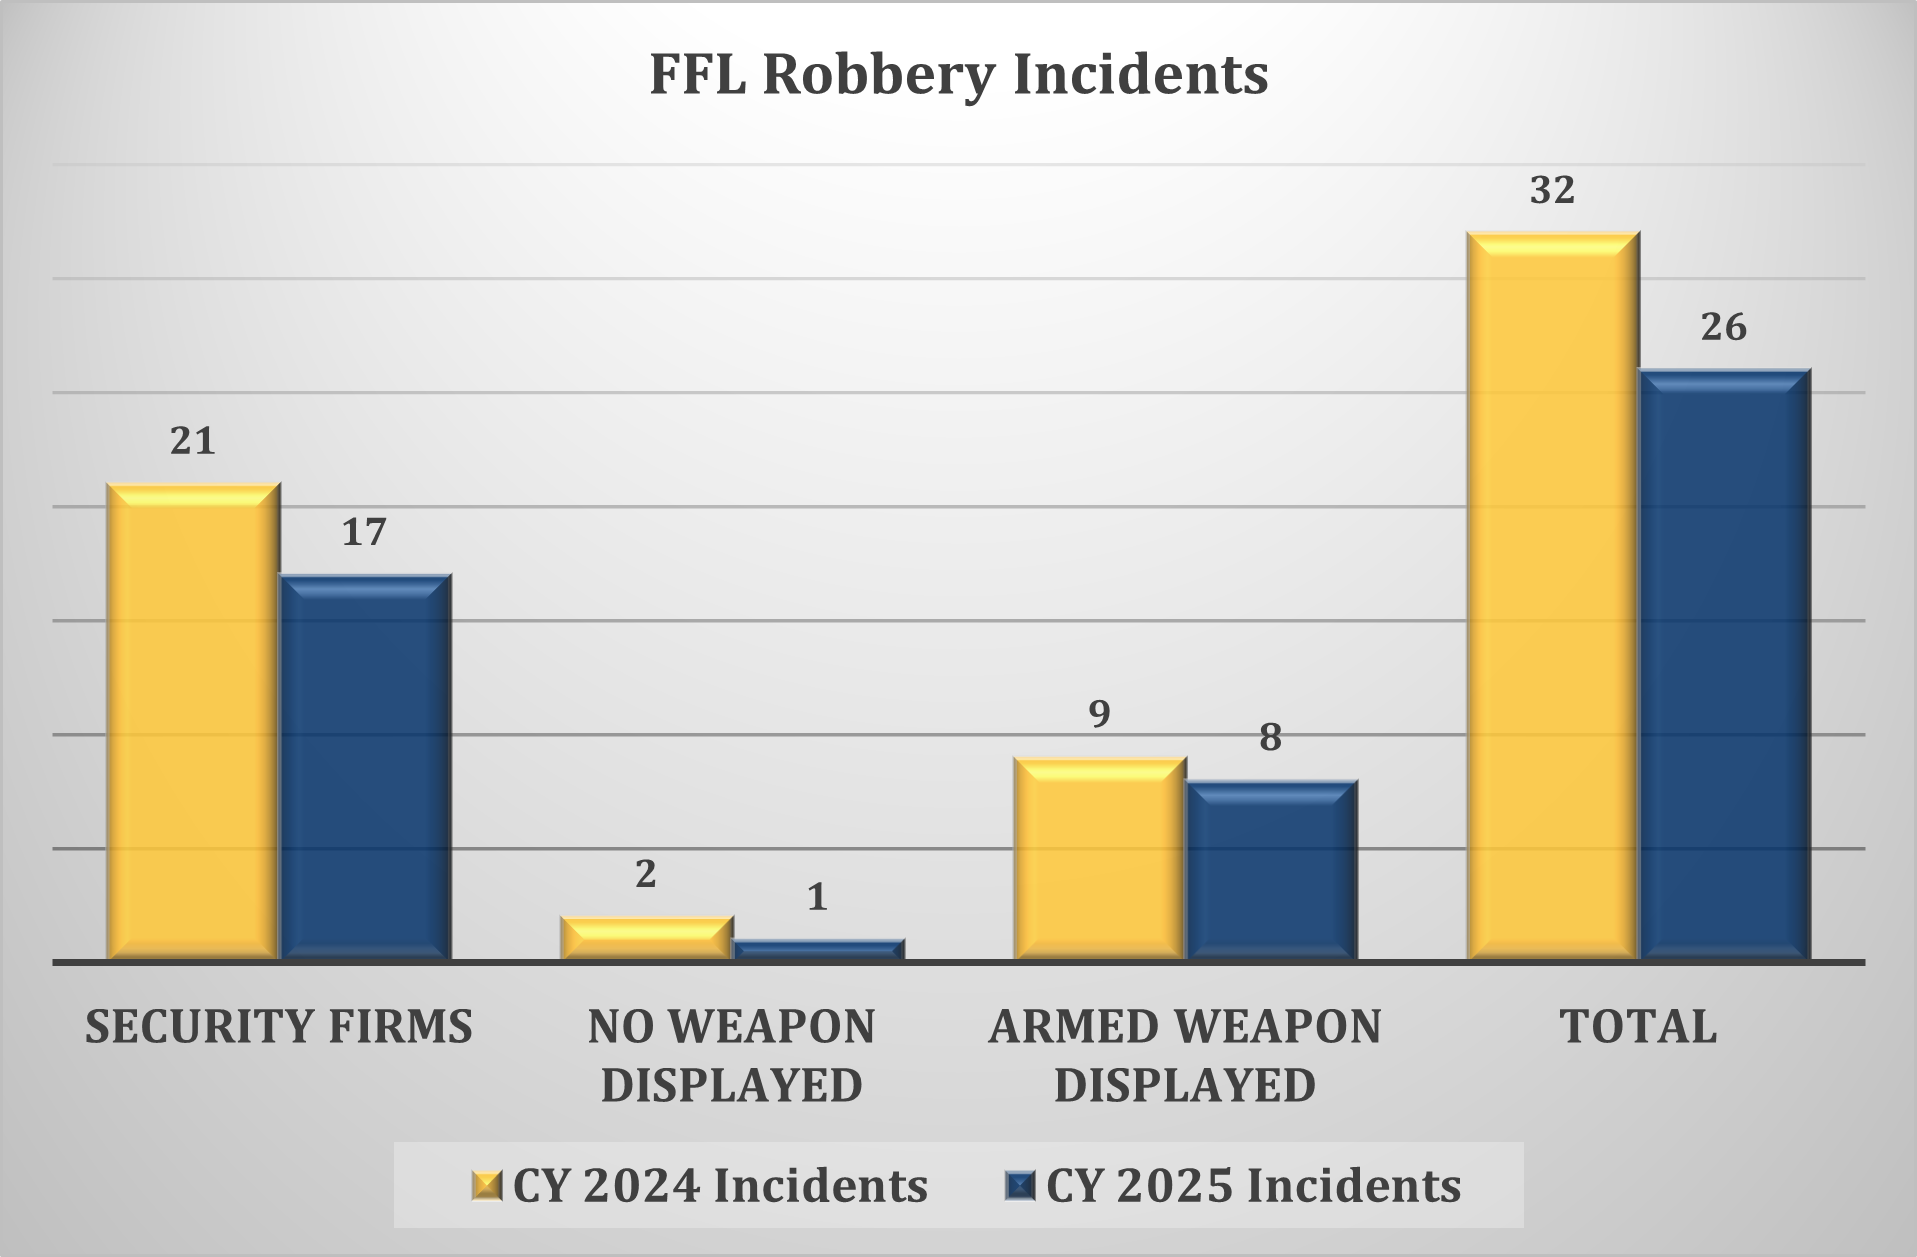
Chart - Calendar Years 2024 and 2025 FFL Robbery Incidents CY 2024: -Security Firms: 21 -No Weapon Displayed: 2 -Armed Weapon Displayed: 9 -Total: 32 CY 2025: -Security Firms: 17 -No Weapon Displayed: 1 -Armed Weapon Displayed: 8 -Total: 26
During CY 2024 and CY 2025, robbery incidents involving of a “Security Firm” decreased approximately 19%. (It should be noted that a “Security Firm” possess a Type 01 FFL, and as such when their personnel are robbed of a firearm, the theft is reported as its own category.
Other FFL robbery incidents are reported as whether or not a weapon was displayed.) Robbery incidents in which a weapon was not displayed decreased by 50%; while “Armed Weapon Displayed” during the robbery decreased by approximately 11%.
FFL Robbery Incidents – Firearms Stolen
(CY 2024 and CY 2025)
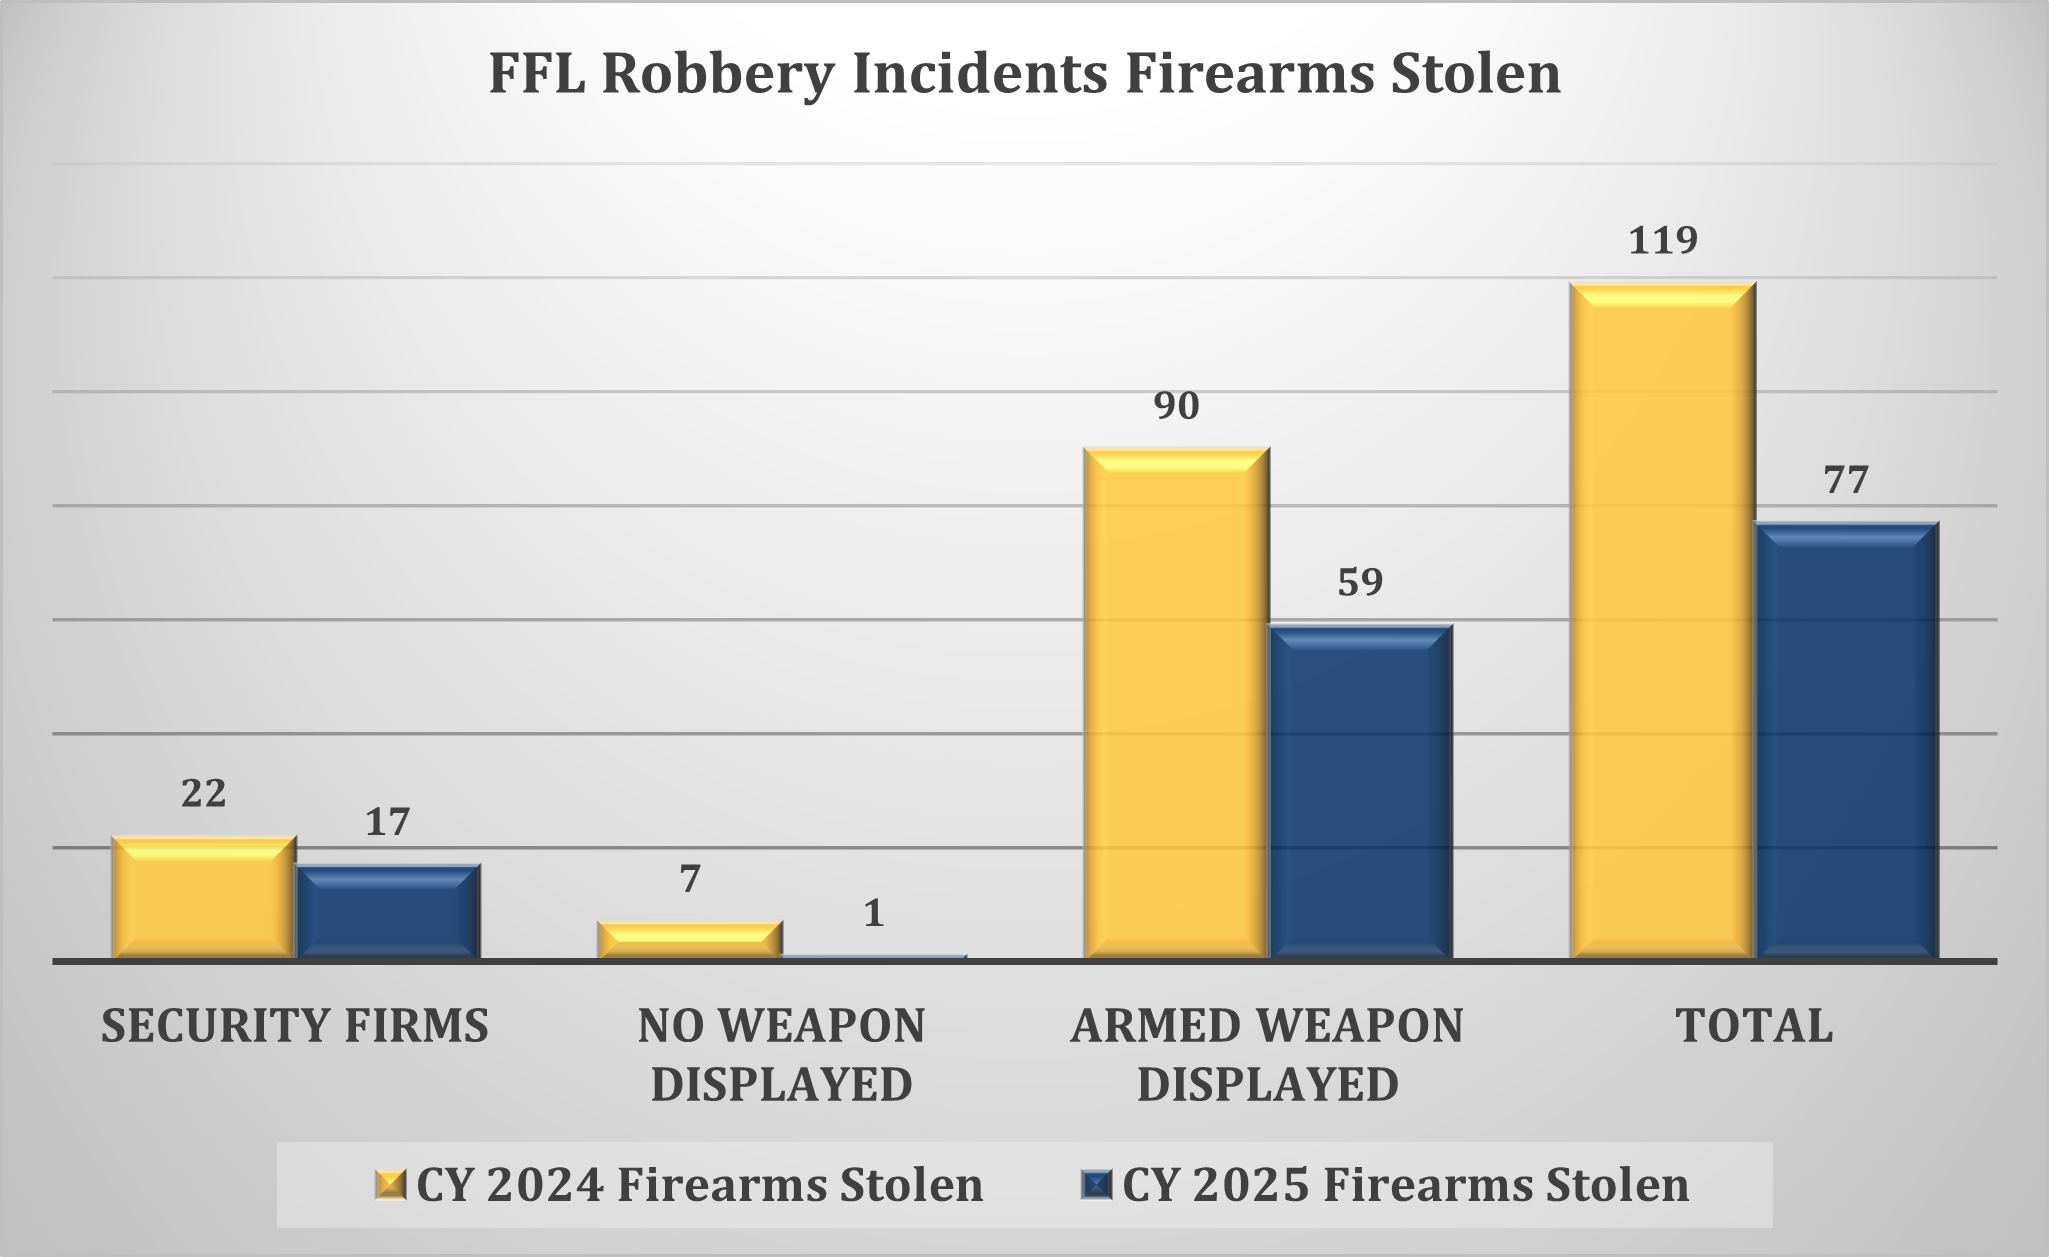
Chart - Calendar Years 2024 and 2025 FFL Robbery Incidents and Firearms Stolen CY 2024 - Security Firms: 22 - No weapons displayed: 7 - Armed weapon displayed: 90 - Total: 119 CY 2025 - Security Firms: 17 - No weapons displayed: 1 - Armed weapon displayed: 59 - Total: 77
During CY 2024 and CY 2025, the number of firearms reported stolen during a robbery incident decreased approximately 35%. The number of firearms reported stolen during a “Security Firm” incident decreased by approximately 23%; firearms reported stolen during a robbery incident and “No Weapon Displayed” decreased by approximately 86%; and firearms reported stolen during a robbery incident and a “Armed Weapon Displayed” decreased by approximately 34%. (It should be noted that during a “Security Firm” robbery incident, the security firm employee/personnel was robbed of their issued firearm.)
